Dashboard Overview
The SupaEval dashboard provides a comprehensive view of your evaluation results, trends, and agent performance metrics.
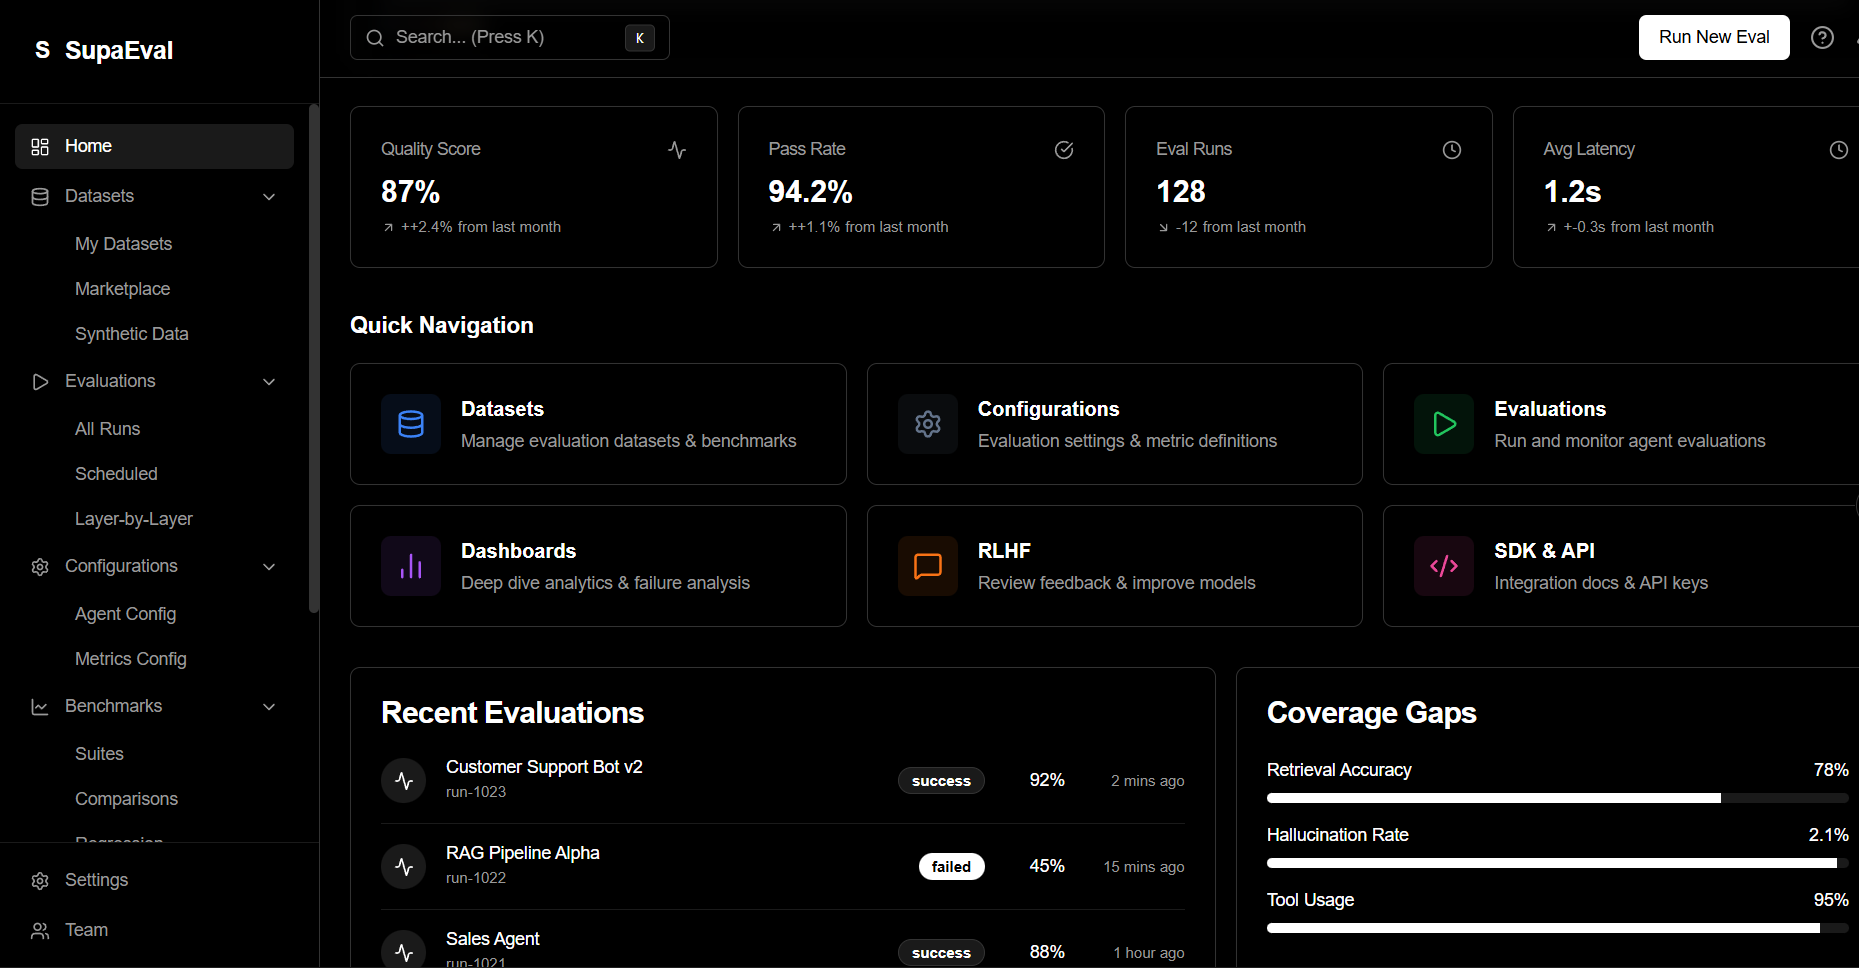
Key Dashboard Sections
Evaluations Overview
View all your evaluation runs, filter by status, dataset, or date range.
Performance Trends
Track metric improvements over time with interactive charts.
Success Breakdown
Visualize pass/fail rates and error categories across test cases.
Cost Analytics
Monitor token usage and API costs per evaluation.
Evaluation Details Page
Click any evaluation to see detailed results:
- Aggregate Metrics - Mean, median, and distribution of scores
- Test Case Results - Individual scores for each test case
- Failure Analysis - Common failure patterns and error messages
- Latency Distribution - Response time percentiles (p50, p95, p99)
- Agent Traces - Step-by-step execution logs
Quick Filters
Use dashboard filters to quickly find evaluations by dataset, date range, or performance threshold. Save common filters for easy access.
Comparison View
Compare multiple evaluations side-by-side to:
- Measure improvement after code changes
- Compare different prompts or models
- A/B test agent configurations
- Track regression during development
Exporting Results
Export evaluation data for external analysis:
- CSV Export - Tabular data for spreadsheet analysis
- JSON Export - Structured data for programmatic processing
- PDF Reports - Formatted reports for stakeholders
Dashboard Customization
Personalize your dashboard:
- Pin favorite datasets or evaluations
- Create custom metric widgets
- Set up alerts for performance thresholds
- Configure default views and filters
Real-time Updates
The dashboard automatically refreshes as evaluations complete. Enable notifications to get alerts when important evaluations finish.